Chapter 4 Midterm assignment
4.1 Dr. Walker’s Lab Report
I have just ran an experiment that measures the effect of exercise on sleep habits. I was able to measure participants average hours of sleep before and after the experiment. I was also able to measure participants sleep efficiency at the end of the experiment. Since the experiment is over, I needed to identify which, if any, of the exercise methods best impacts sleep.
The packages we will be using for this assignment include: readxl, dplyr, tibble, tidyverse, mosaic, ggplot2, supernova, and stats.
Here is my report.
4.2 DATA
In this section, I ran some code to load the two data sets for the analysis below. I am using glimpse and head to preview my two data sets to ensure they correctly have been loaded.
participant_info_midterm <- read_excel("data/participant_info_midterm.xlsx")
glimpse(participant_info_midterm)
## Rows: 100
## Columns: 4
## $ ID <chr> "P001", "P002", "P003", "P004", "P005", "P006", "P007", "P008", "P009", "P010", "P…
## $ Exercise_Group <chr> "NONE", "Nonee", "None", "None", "None", "None", "None", "None", "None", "None", "…
## $ Sex <chr> "Male", "Malee", "Female", "Female", "Male", "Female", "Male", "Female", "Male", "…
## $ Age <dbl> 35, 57, 26, 29, 33, 33, 32, 30, 37, 28, 30, 20, 42, 31, 33, 26, 41, 18, 28, 37, 48…## # A tibble: 6 × 4
## ID Exercise_Group Sex Age
## <chr> <chr> <chr> <dbl>
## 1 P001 NONE Male 35
## 2 P002 Nonee Malee 57
## 3 P003 None Female 26
## 4 P004 None Female 29
## 5 P005 None Male 33
## 6 P006 None Female 33## Rows: 100
## Columns: 4
## $ ID <chr> "P001", "P002", "P003", "P004", "P005", "P006", "P007", "P008", "P009", "P010", …
## $ Pre_Sleep <chr> "zzz-5.8", "Sleep-6.6", NA, "SLEEP-7.2", "score-7.4", "Sleep-6.6", "Sleep-6", "z…
## $ Post_Sleep <dbl> 4.7, 7.4, 6.2, 7.3, 7.4, 7.1, 6.7, 9.0, 5.1, 6.3, 6.2, 4.6, 7.6, 7.2, 4.6, 8.2, …
## $ Sleep_Efficiency <dbl> 81.6, 75.7, 82.9, 83.6, 83.5, 88.5, 83.6, 73.4, 88.2, 80.4, 85.2, 82.9, 74.0, 92…## # A tibble: 6 × 4
## ID Pre_Sleep Post_Sleep Sleep_Efficiency
## <chr> <chr> <dbl> <dbl>
## 1 P001 zzz-5.8 4.7 81.6
## 2 P002 Sleep-6.6 7.4 75.7
## 3 P003 <NA> 6.2 82.9
## 4 P004 SLEEP-7.2 7.3 83.6
## 5 P005 score-7.4 7.4 83.5
## 6 P006 Sleep-6.6 7.1 88.54.3 DATA CLEANING
In this section, we will be cleaning the data. The column names thankfully do not have to be cleaned.
In this piece of code below, we are standardizing the column titled Exercise_Group.
participant_info_midterm<-participant_info_midterm %>%
  mutate(Exercise_Group =case_when(
    Exercise_Group=="NONE" ~"None",
    Exercise_Group=="Nonee" ~ "None",
    Exercise_Group=="N"~"None",
    Exercise_Group=="C"~"Cardio",
    Exercise_Group=="WEIGHTS"~"Weights",
    Exercise_Group=="WEIGHTZ"~"Weights",
    Exercise_Group=="WEIGHTSSS"~"Weights",
    Exercise_Group=="CW"~"Cardio+Weights",
    Exercise_Group=="C+W"~"Cardio+Weights",
    TRUE~Exercise_Group
  ))
In this piece of code below, we are standardizing the column titled Sex.
participant_info_midterm<-participant_info_midterm %>%
  mutate(Sex=case_when(
    Sex=="Malee"~"Male",
    Sex=="MALE"~"Male",
    Sex=="M"~"Male",
    Sex=="Mal"~"Male",
    Sex=="Femalee"~"Female",
    Sex=="F"~"Female",
    TRUE~Sex
  ))
Since our data is now all clean, the last step was to merge our two data sets.
We can now see that our data is cleaned and merged below.
Data_Midterm<- merge(participant_info_midterm, sleep_data_midterm, by="ID")

knitr::kable(Data_Midterm)| ID | Exercise_Group | Sex | Age | Pre_Sleep | Post_Sleep | Sleep_Efficiency |
|---|---|---|---|---|---|---|
| P001 | None | Male | 35 | zzz-5.8 | 4.7 | 81.6 |
| P002 | None | Male | 57 | Sleep-6.6 | 7.4 | 75.7 |
| P003 | None | Female | 26 | NA | 6.2 | 82.9 |
| P004 | None | Female | 29 | SLEEP-7.2 | 7.3 | 83.6 |
| P005 | None | Male | 33 | score-7.4 | 7.4 | 83.5 |
| P006 | None | Female | 33 | Sleep-6.6 | 7.1 | 88.5 |
| P007 | None | Male | 32 | Sleep-6 | 6.7 | 83.6 |
| P008 | None | Female | 30 | zzz-8.1 | 9.0 | 73.4 |
| P009 | None | Male | 37 | sleep-5.5 | 5.1 | 88.2 |
| P010 | None | Female | 28 | sleep-5.7 | 6.3 | 80.4 |
| P011 | None | Female | 30 | score-7 | 6.2 | 85.2 |
| P012 | None | Male | 20 | sleep-5.5 | 4.6 | 82.9 |
| P013 | None | Male | 42 | Sleep-8 | 7.6 | 74.0 |
| P014 | None | Male | 31 | NA | 7.2 | 92.0 |
| P015 | None | Female | 33 | score-5.3 | 4.6 | 89.6 |
| P016 | None | Male | 26 | SLEEP-7.8 | 8.2 | 71.7 |
| P017 | None | Female | 41 | zzz-6.7 | 7.6 | 78.5 |
| P018 | None | Male | 18 | SLEEP-7.4 | 7.2 | 73.8 |
| P019 | None | Male | 28 | NA | 5.7 | 69.1 |
| P020 | None | Female | 37 | score-7.1 | 6.8 | 81.5 |
| P021 | None | Male | 48 | zzz-6.8 | 7.1 | 78.7 |
| P022 | None | Female | 37 | Sleep-5.7 | 5.8 | 90.4 |
| P023 | None | Female | 42 | sleep-5 | NA | 81.3 |
| P024 | None | Female | 39 | score-6 | 5.6 | 76.6 |
| P025 | None | Male | 20 | Sleep-6.2 | 7.1 | 81.1 |
| P026 | Cardio | Female | 34 | score-5.2 | 6.7 | 84.5 |
| P027 | Cardio | Female | 28 | sleep-6.6 | 7.8 | 75.9 |
| P028 | Cardio | Female | 29 | SLEEP-5.6 | 6.3 | 79.0 |
| P029 | Cardio | Male | 36 | Sleep-6 | 6.3 | 87.6 |
| P030 | Cardio | Male | 30 | SLEEP-5.7 | NA | 88.0 |
| P031 | Cardio | Female | 42 | Sleep-6.9 | 7.6 | 88.5 |
| P032 | Cardio | Female | 18 | SLEEP-6.9 | 7.9 | 87.8 |
| P033 | Cardio | Female | 38 | zzz-5.9 | 6.6 | 80.9 |
| P034 | Cardio | Female | 20 | score-5.2 | 6.0 | 92.8 |
| P035 | Cardio | Male | 30 | SLEEP-6.7 | 8.0 | 86.4 |
| P036 | Cardio | Female | 19 | zzz-5.4 | 5.7 | 88.0 |
| P037 | Cardio | Male | 35 | NA | 9.7 | 85.6 |
| P038 | Cardio | Female | 34 | zzz-7 | 8.1 | 79.6 |
| P039 | Cardio | Male | 39 | SLEEP-5.6 | 6.3 | 81.3 |
| P040 | Cardio | Female | 39 | zzz-6 | 8.1 | 79.7 |
| P041 | Cardio | Male | 29 | zzz-7 | NA | 83.2 |
| P042 | Cardio | Female | 28 | SLEEP-5.6 | 7.3 | 81.9 |
| P043 | Cardio | Female | 43 | zzz-6.9 | 8.2 | 81.3 |
| P044 | Cardio | Female | 33 | zzz-5.8 | 7.1 | 88.7 |
| P045 | Cardio | Male | 31 | score-4 | 5.1 | 86.0 |
| P046 | Cardio | Male | 30 | SLEEP-7.1 | 8.5 | 95.0 |
| P047 | Cardio | Female | 42 | SLEEP-5.8 | 7.0 | 85.5 |
| P048 | Cardio | Fem | 31 | NA | 7.7 | 93.4 |
| P049 | Cardio | Male | 40 | sleep-6.7 | 8.2 | 82.5 |
| P050 | Cardio | Male | 31 | zzz-6.4 | 8.4 | 101.5 |
| P051 | Weights | Male | 18 | Sleep-6.5 | 6.8 | 80.4 |
| P052 | Weights | Male | 23 | Sleep-7.2 | 8.3 | 76.7 |
| P053 | Weights | Female | 39 | score-7.3 | 9.1 | 82.2 |
| P054 | Weights | Female | 37 | zzz-7 | 7.7 | 88.6 |
| P055 | Weights | Female | 31 | sleep-6.2 | 6.6 | 76.6 |
| P056 | Weights | Female | 38 | Sleep-6.2 | NA | 80.2 |
| P057 | Weights | Male | 26 | sleep-7.3 | 7.4 | 77.7 |
| P058 | Weights | Male | 18 | Sleep-6.2 | 6.3 | 85.3 |
| P059 | Weights | Female | 38 | SLEEP-6.2 | 7.3 | 80.5 |
| P060 | Weights | Male | 39 | SLEEP-6.6 | 6.9 | 80.2 |
| P061 | Weights | Female | 27 | SLEEP-6.1 | 6.6 | 77.9 |
| P062 | Weights | Male | 35 | score-6.7 | 7.2 | 80.8 |
| P063 | Weights | Female | 18 | zzz-5.8 | 5.1 | 82.9 |
| P064 | Weights | Female | 38 | score-5.1 | 5.2 | 80.9 |
| P065 | Weights | Female | 38 | score-5.5 | 7.2 | 76.1 |
| P066 | Weights | Female | 46 | zzz-7 | 8.7 | 74.8 |
| P067 | Weights | Male | 41 | NA | 6.7 | 92.8 |
| P068 | Weights | Female | 22 | zzz-5.4 | 5.7 | 88.0 |
| P069 | Weights | Female | 45 | sleep-6.4 | 7.2 | 79.1 |
| P070 | Weights | Female | 25 | score-7.5 | 8.7 | 89.5 |
| P071 | Weights | Female | 27 | zzz-6.6 | 7.4 | 87.4 |
| P072 | Weights | Female | 32 | NA | 6.9 | 86.9 |
| P073 | Weights | Female | 44 | Sleep-5.6 | 6.3 | 83.6 |
| P074 | Weights | Female | 42 | SLEEP-5.1 | NA | 87.1 |
| P075 | Weights | Male | 32 | sleep-6.5 | 7.0 | 81.4 |
| P076 | Cardio+Weights | Male | 37 | sleep-5.7 | 6.5 | 83.9 |
| P077 | Cardio+Weights | Female | 37 | score-5.9 | 7.3 | 92.4 |
| P078 | Cardio+Weights | Female | 24 | score-6.6 | 7.2 | 74.5 |
| P079 | Cardio+Weights | Male | 38 | SLEEP-6.6 | 7.4 | 89.0 |
| P080 | Cardio+Weights | Male | 42 | Sleep-7.2 | 8.1 | 94.5 |
| P081 | Cardio+Weights | Female | 38 | Sleep-8 | 8.9 | 74.5 |
| P082 | Cardio+Weights | Male | 46 | score-6.5 | 6.4 | 88.7 |
| P083 | Cardio+Weights | Female | 49 | score-5.9 | 6.8 | 90.4 |
| P084 | Cardio+Weights | Female | 31 | sleep-8 | 8.4 | 80.2 |
| P085 | Cardio+Weights | Male | 33 | score-6.2 | 6.9 | 89.9 |
| P086 | Cardio+Weights | Female | 46 | SLEEP-6.2 | 7.4 | 83.1 |
| P087 | Cardio+Weights | Male | 18 | SLEEP-6.7 | 7.6 | 96.3 |
| P088 | Cardio+Weights | Male | 34 | score-7.5 | 8.9 | 81.2 |
| P089 | Cardio+Weights | Female | 42 | score-5.9 | 7.0 | 90.6 |
| P090 | Cardio+Weights | Female | 41 | Sleep-7.2 | 7.6 | 79.9 |
| P091 | Cardio+Weights | Male | 46 | zzz-7.3 | 7.9 | 87.5 |
| P092 | Cardio+Weights | Male | 18 | sleep-5.6 | 6.6 | 86.3 |
| P093 | Cardio+Weights | Female | 40 | Sleep-8 | 9.5 | 90.4 |
| P094 | Cardio+Weights | Male | 35 | zzz-6.1 | 7.2 | 84.4 |
| P095 | Cardio+Weights | Female | 29 | Sleep-5.7 | NA | 85.0 |
| P096 | Cardio+Weights | Female | 37 | sleep-5.9 | 7.1 | 93.8 |
| P097 | Cardio+Weights | Male | 24 | SLEEP-4.4 | 4.7 | 88.9 |
| P098 | Cardio+Weights | Female | 35 | score-5.9 | 6.9 | 92.6 |
| P099 | Cardio+Weights | Male | 28 | NA | 8.8 | 88.5 |
| P100 | Cardio+Weights | Male | 32 | zzz-6.5 | 7.3 | 84.2 |
4.4 CREATE DERIVED VARIABLES
We now want to Create a column titled Sleep_Difference with Post_Sleep - Pre_Sleep.
First we got to check if Post_Sleep and Pre_Sleep columns are numeric below.
## [1] TRUE## [1] FALSEPost_Sleep IS numeric but Pre_Sleep is NOT numeric. Before we use code to turn it into numeric, we first have to clean the column further since it has letters and numbers. I did this by separating the letters and numbers into separate columns below.
Data_Midterm<- Data_Midterm %>%
  separate(
    col= Pre_Sleep,
    into= c("Pre_Sleep_Letters", "Pre_Sleep"),
    sep= "-"
  )
I then turned the Pre_Sleep column into numeric and deleted Pre_Sleep_Letters column. You can see here that the Pre_Sleep_Letters column is gone and we are left with Pre_Sleep Column cleaned up. I also checked if Pre_Sleep column is numeric and it is. All of this can be seen below.
Data_Midterm<- Data_Midterm%>%
  mutate(across(
    c("Pre_Sleep"),
    ~as.numeric(.)
  ))

Data_Midterm<- Data_Midterm %>%
  select(-"Pre_Sleep_Letters")

is.numeric(Data_Midterm$Pre_Sleep)
## [1] TRUE## ID Exercise_Group Sex Age Pre_Sleep Post_Sleep Sleep_Efficiency
## 1 P001 None Male 35 5.8 4.7 81.6
## 2 P002 None Male 57 6.6 7.4 75.7
## 3 P003 None Female 26 NA 6.2 82.9
## 4 P004 None Female 29 7.2 7.3 83.6
## 5 P005 None Male 33 7.4 7.4 83.5
## 6 P006 None Female 33 6.6 7.1 88.5Now we can create our new column titled Sleep_Difference.
Furthermore, I identified that there was 14 participants with no Sleep_Difference scores. I removed them from our data leaving us with 86 participants which you can view below.
Data_Midterm<-Data_Midterm%>%
  mutate(Sleep_Difference=Post_Sleep-Pre_Sleep)

Data_Midterm$Sleep_Difference %>% is.na() %>% which()
## [1] 3 14 19 23 30 37 41 48 56 67 72 74 95 99| ID | Exercise_Group | Sex | Age | Pre_Sleep | Post_Sleep | Sleep_Efficiency | Sleep_Difference |
|---|---|---|---|---|---|---|---|
| P001 | None | Male | 35 | 5.8 | 4.7 | 81.6 | -1.1 |
| P002 | None | Male | 57 | 6.6 | 7.4 | 75.7 | 0.8 |
| P004 | None | Female | 29 | 7.2 | 7.3 | 83.6 | 0.1 |
| P005 | None | Male | 33 | 7.4 | 7.4 | 83.5 | 0.0 |
| P006 | None | Female | 33 | 6.6 | 7.1 | 88.5 | 0.5 |
| P007 | None | Male | 32 | 6.0 | 6.7 | 83.6 | 0.7 |
| P008 | None | Female | 30 | 8.1 | 9.0 | 73.4 | 0.9 |
| P009 | None | Male | 37 | 5.5 | 5.1 | 88.2 | -0.4 |
| P010 | None | Female | 28 | 5.7 | 6.3 | 80.4 | 0.6 |
| P011 | None | Female | 30 | 7.0 | 6.2 | 85.2 | -0.8 |
| P012 | None | Male | 20 | 5.5 | 4.6 | 82.9 | -0.9 |
| P013 | None | Male | 42 | 8.0 | 7.6 | 74.0 | -0.4 |
| P015 | None | Female | 33 | 5.3 | 4.6 | 89.6 | -0.7 |
| P016 | None | Male | 26 | 7.8 | 8.2 | 71.7 | 0.4 |
| P017 | None | Female | 41 | 6.7 | 7.6 | 78.5 | 0.9 |
| P018 | None | Male | 18 | 7.4 | 7.2 | 73.8 | -0.2 |
| P020 | None | Female | 37 | 7.1 | 6.8 | 81.5 | -0.3 |
| P021 | None | Male | 48 | 6.8 | 7.1 | 78.7 | 0.3 |
| P022 | None | Female | 37 | 5.7 | 5.8 | 90.4 | 0.1 |
| P024 | None | Female | 39 | 6.0 | 5.6 | 76.6 | -0.4 |
| P025 | None | Male | 20 | 6.2 | 7.1 | 81.1 | 0.9 |
| P026 | Cardio | Female | 34 | 5.2 | 6.7 | 84.5 | 1.5 |
| P027 | Cardio | Female | 28 | 6.6 | 7.8 | 75.9 | 1.2 |
| P028 | Cardio | Female | 29 | 5.6 | 6.3 | 79.0 | 0.7 |
| P029 | Cardio | Male | 36 | 6.0 | 6.3 | 87.6 | 0.3 |
| P031 | Cardio | Female | 42 | 6.9 | 7.6 | 88.5 | 0.7 |
| P032 | Cardio | Female | 18 | 6.9 | 7.9 | 87.8 | 1.0 |
| P033 | Cardio | Female | 38 | 5.9 | 6.6 | 80.9 | 0.7 |
| P034 | Cardio | Female | 20 | 5.2 | 6.0 | 92.8 | 0.8 |
| P035 | Cardio | Male | 30 | 6.7 | 8.0 | 86.4 | 1.3 |
| P036 | Cardio | Female | 19 | 5.4 | 5.7 | 88.0 | 0.3 |
| P038 | Cardio | Female | 34 | 7.0 | 8.1 | 79.6 | 1.1 |
| P039 | Cardio | Male | 39 | 5.6 | 6.3 | 81.3 | 0.7 |
| P040 | Cardio | Female | 39 | 6.0 | 8.1 | 79.7 | 2.1 |
| P042 | Cardio | Female | 28 | 5.6 | 7.3 | 81.9 | 1.7 |
| P043 | Cardio | Female | 43 | 6.9 | 8.2 | 81.3 | 1.3 |
| P044 | Cardio | Female | 33 | 5.8 | 7.1 | 88.7 | 1.3 |
| P045 | Cardio | Male | 31 | 4.0 | 5.1 | 86.0 | 1.1 |
| P046 | Cardio | Male | 30 | 7.1 | 8.5 | 95.0 | 1.4 |
| P047 | Cardio | Female | 42 | 5.8 | 7.0 | 85.5 | 1.2 |
| P049 | Cardio | Male | 40 | 6.7 | 8.2 | 82.5 | 1.5 |
| P050 | Cardio | Male | 31 | 6.4 | 8.4 | 101.5 | 2.0 |
| P051 | Weights | Male | 18 | 6.5 | 6.8 | 80.4 | 0.3 |
| P052 | Weights | Male | 23 | 7.2 | 8.3 | 76.7 | 1.1 |
| P053 | Weights | Female | 39 | 7.3 | 9.1 | 82.2 | 1.8 |
| P054 | Weights | Female | 37 | 7.0 | 7.7 | 88.6 | 0.7 |
| P055 | Weights | Female | 31 | 6.2 | 6.6 | 76.6 | 0.4 |
| P057 | Weights | Male | 26 | 7.3 | 7.4 | 77.7 | 0.1 |
| P058 | Weights | Male | 18 | 6.2 | 6.3 | 85.3 | 0.1 |
| P059 | Weights | Female | 38 | 6.2 | 7.3 | 80.5 | 1.1 |
| P060 | Weights | Male | 39 | 6.6 | 6.9 | 80.2 | 0.3 |
| P061 | Weights | Female | 27 | 6.1 | 6.6 | 77.9 | 0.5 |
| P062 | Weights | Male | 35 | 6.7 | 7.2 | 80.8 | 0.5 |
| P063 | Weights | Female | 18 | 5.8 | 5.1 | 82.9 | -0.7 |
| P064 | Weights | Female | 38 | 5.1 | 5.2 | 80.9 | 0.1 |
| P065 | Weights | Female | 38 | 5.5 | 7.2 | 76.1 | 1.7 |
| P066 | Weights | Female | 46 | 7.0 | 8.7 | 74.8 | 1.7 |
| P068 | Weights | Female | 22 | 5.4 | 5.7 | 88.0 | 0.3 |
| P069 | Weights | Female | 45 | 6.4 | 7.2 | 79.1 | 0.8 |
| P070 | Weights | Female | 25 | 7.5 | 8.7 | 89.5 | 1.2 |
| P071 | Weights | Female | 27 | 6.6 | 7.4 | 87.4 | 0.8 |
| P073 | Weights | Female | 44 | 5.6 | 6.3 | 83.6 | 0.7 |
| P075 | Weights | Male | 32 | 6.5 | 7.0 | 81.4 | 0.5 |
| P076 | Cardio+Weights | Male | 37 | 5.7 | 6.5 | 83.9 | 0.8 |
| P077 | Cardio+Weights | Female | 37 | 5.9 | 7.3 | 92.4 | 1.4 |
| P078 | Cardio+Weights | Female | 24 | 6.6 | 7.2 | 74.5 | 0.6 |
| P079 | Cardio+Weights | Male | 38 | 6.6 | 7.4 | 89.0 | 0.8 |
| P080 | Cardio+Weights | Male | 42 | 7.2 | 8.1 | 94.5 | 0.9 |
| P081 | Cardio+Weights | Female | 38 | 8.0 | 8.9 | 74.5 | 0.9 |
| P082 | Cardio+Weights | Male | 46 | 6.5 | 6.4 | 88.7 | -0.1 |
| P083 | Cardio+Weights | Female | 49 | 5.9 | 6.8 | 90.4 | 0.9 |
| P084 | Cardio+Weights | Female | 31 | 8.0 | 8.4 | 80.2 | 0.4 |
| P085 | Cardio+Weights | Male | 33 | 6.2 | 6.9 | 89.9 | 0.7 |
| P086 | Cardio+Weights | Female | 46 | 6.2 | 7.4 | 83.1 | 1.2 |
| P087 | Cardio+Weights | Male | 18 | 6.7 | 7.6 | 96.3 | 0.9 |
| P088 | Cardio+Weights | Male | 34 | 7.5 | 8.9 | 81.2 | 1.4 |
| P089 | Cardio+Weights | Female | 42 | 5.9 | 7.0 | 90.6 | 1.1 |
| P090 | Cardio+Weights | Female | 41 | 7.2 | 7.6 | 79.9 | 0.4 |
| P091 | Cardio+Weights | Male | 46 | 7.3 | 7.9 | 87.5 | 0.6 |
| P092 | Cardio+Weights | Male | 18 | 5.6 | 6.6 | 86.3 | 1.0 |
| P093 | Cardio+Weights | Female | 40 | 8.0 | 9.5 | 90.4 | 1.5 |
| P094 | Cardio+Weights | Male | 35 | 6.1 | 7.2 | 84.4 | 1.1 |
| P096 | Cardio+Weights | Female | 37 | 5.9 | 7.1 | 93.8 | 1.2 |
| P097 | Cardio+Weights | Male | 24 | 4.4 | 4.7 | 88.9 | 0.3 |
| P098 | Cardio+Weights | Female | 35 | 5.9 | 6.9 | 92.6 | 1.0 |
| P100 | Cardio+Weights | Male | 32 | 6.5 | 7.3 | 84.2 | 0.8 |
Next we want to create a new column titled AgeGroup2 using via case_when. You can see below that we have successfully created this new column.
Data_Midterm<-Data_Midterm%>%
  mutate(AgeGroup2=case_when(
    Age <35~"Younger_Adult",
    Age >=35~"Older_Adult"
  ))

head(Data_Midterm)
## ID Exercise_Group Sex Age Pre_Sleep Post_Sleep Sleep_Efficiency Sleep_Difference AgeGroup2
## 1 P001 None Male 35 5.8 4.7 81.6 -1.1 Older_Adult
## 2 P002 None Male 57 6.6 7.4 75.7 0.8 Older_Adult
## 3 P004 None Female 29 7.2 7.3 83.6 0.1 Younger_Adult
## 4 P005 None Male 33 7.4 7.4 83.5 0.0 Younger_Adult
## 5 P006 None Female 33 6.6 7.1 88.5 0.5 Younger_Adult
## 6 P007 None Male 32 6.0 6.7 83.6 0.7 Younger_Adult4.5 DESCRIPTIVE STATISTICS
Below we are exploring the descriptive statistics for Sleep_Difference.
##   min  Q1 median  Q3 max      mean        sd  n missing
##  -1.1 0.3   0.75 1.1 2.1 0.6825581 0.6610494 86       0
For Sleep_Difference column, the statistics is as follows:
Mean: 0.68
SD: 0.66
Min: -1.1
Max: 2.1
Below we are exploring the descriptive statistics for Sleep_Efficiency.
##   min     Q1 median     Q3   max     mean       sd  n missing
##  71.7 79.975   83.3 88.425 101.5 83.77558 5.973804 86       0
For Sleep_Efficiency column, the statistics is as follows:
Mean: 83.78
SD: 5.98
Min: 71.7
Max: 101.5
Below we explore the pairwise means of Sleep_Difference by Exercise_Group.
Sleep_Diff_by_Exercise<-favstats(Sleep_Difference~Exercise_Group, data = Data_Midterm)
Sleep_Diff_by_Exercise
## Exercise_Group min Q1 median Q3 max mean sd n missing
## 1 Cardio 0.3 0.70 1.2 1.4 2.1 1.13809524 0.4852589 21 0
## 2 Cardio+Weights -0.1 0.65 0.9 1.1 1.5 0.86086957 0.3822649 23 0
## 3 None -1.1 -0.40 0.1 0.6 0.9 0.04761905 0.6384505 21 0
## 4 Weights -0.7 0.30 0.5 1.1 1.8 0.66666667 0.6126445 21 0For pairwise means, the means are as follows:
Cardio: 1.14
Cardio+Weights: 0.86
None: 0.048
Weights: 0.67
Below we explore the pairwise means of Sleep_Efficiency by Exercise_Group.
Sleep_Effic_by_Exercise<-favstats(Sleep_Efficiency~Exercise_Group, data = Data_Midterm)
Sleep_Effic_by_Exercise
## Exercise_Group min Q1 median Q3 max mean sd n missing
## 1 Cardio 75.9 81.3 85.5 88.0 101.5 85.44762 5.991629 21 0
## 2 Cardio+Weights 74.5 83.5 88.7 90.5 96.3 86.83478 5.980317 23 0
## 3 None 71.7 76.6 81.5 83.6 90.4 81.07143 5.551499 21 0
## 4 Weights 74.8 77.9 80.8 83.6 89.5 81.45714 4.311331 21 0For pairwise means, the means are as follows:
Cardio: 85.45
Cardio+Weights: 86.83
None: 81.07
Weights: 81.46
4.6 VISUALIZATIONS (PLOTS)
I proceeded to create plots to be able to visualize things better.
ggplot(Data_Midterm, aes(x=Exercise_Group, y=Sleep_Difference))+
  geom_boxplot(fill="orange", color="black")+
  coord_flip() +
  labs(
    title = "Exercise Group by Sleep Difference",
    x="Exercise Type",
    y="Sleep Difference")+
theme(plot.title = element_text(size=20, family="serif", face="bold"),
             axis.title = element_text(size=15, family ="serif"),
             axis.text = element_text(size = 10, family = "serif"))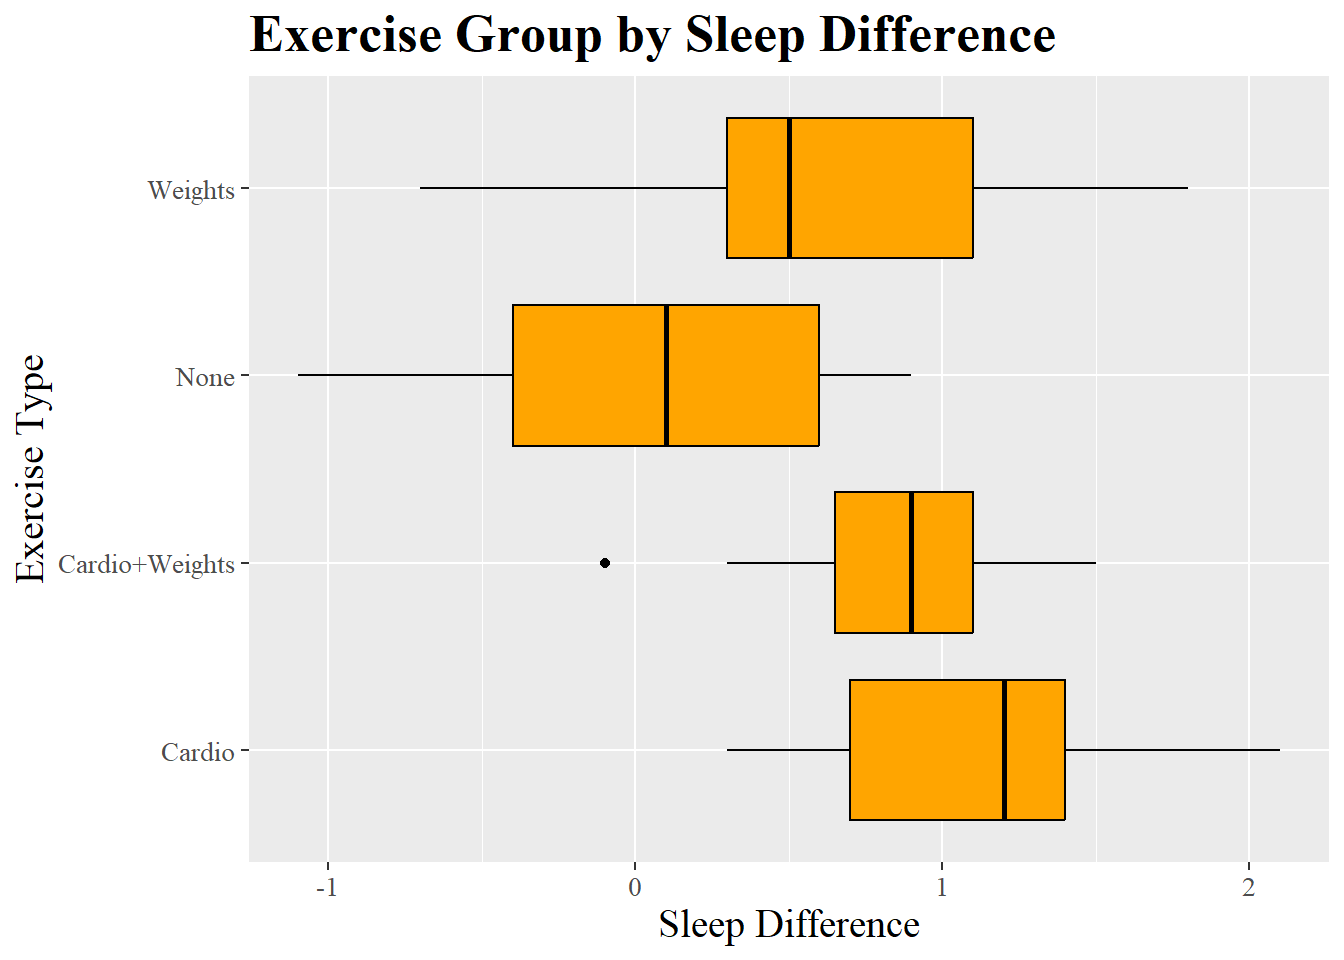
Figure 4.1: Boxplot showing exercise group by sleep difference in order to look at it visually
Above a box plot was created to look at sleep difference by exercise group.
ggplot(Data_Midterm, aes(x=Exercise_Group, y=Sleep_Efficiency))+
  geom_boxplot(fill="orange", color="black")+
  coord_flip() +
  labs(
    title = "Exercise Group by Sleep Efficiency",
    x="Exercise Type",
    y="Sleep Efficiency")+
  theme(plot.title = element_text(size=20, family="serif", face="bold"),
        axis.title = element_text(size=15, family ="serif"),
        axis.text = element_text(size = 10, family = "serif"))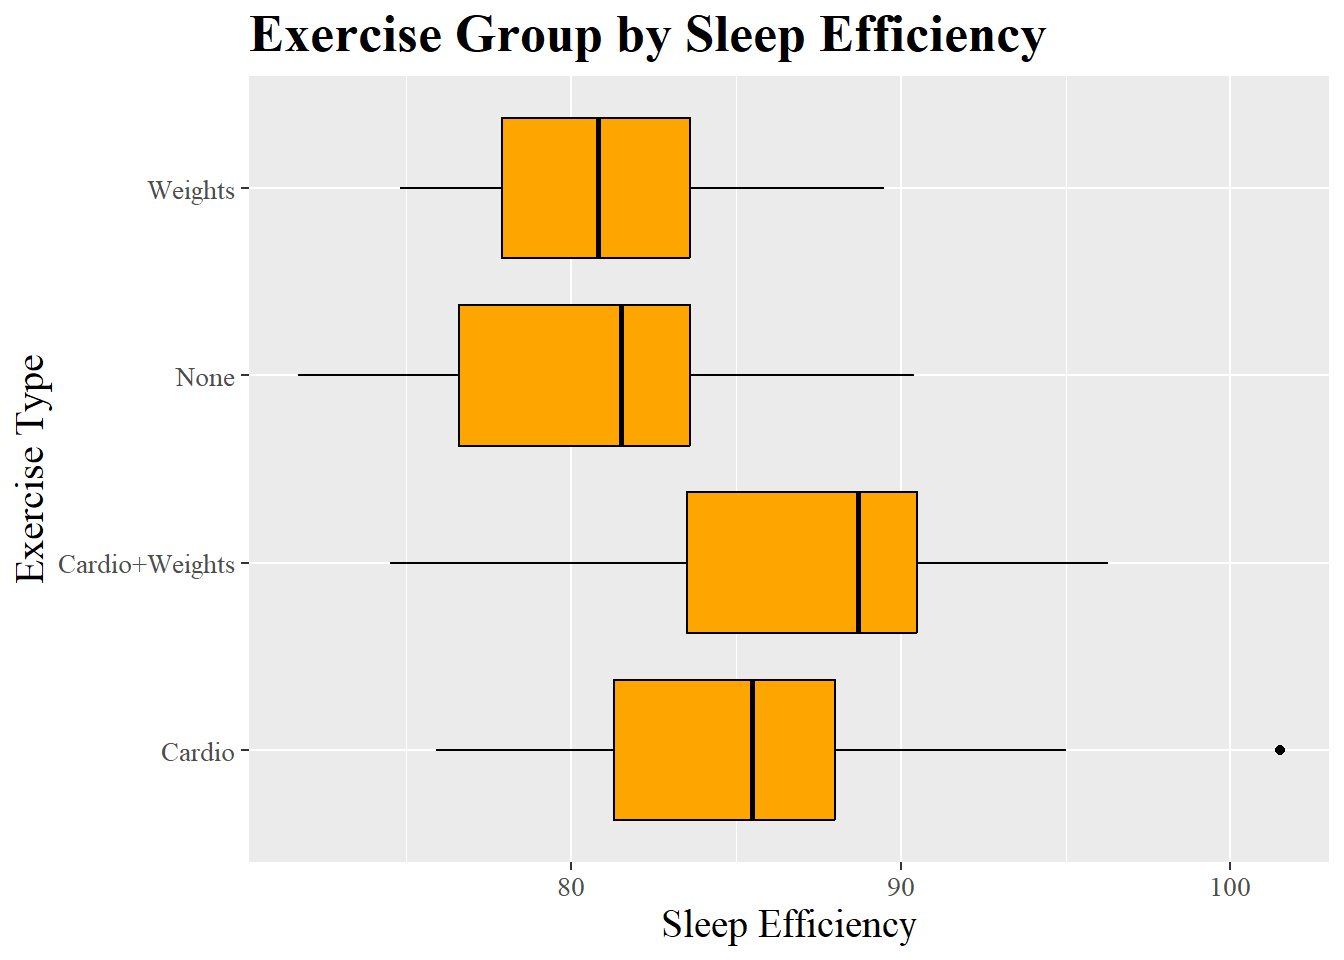
Figure 4.2: Boxplot showing sleep efficiency by exercise group in order to look at it visually
Above a box plot was created to look at sleep efficiency by exercise group.
ggplot(Data_Midterm, aes(x=Sleep_Difference, y=Sleep_Efficiency))+
  geom_point(alpha=1, size=2)+
  labs(
    title = "Sleep Difference by Sleep Efficiency",
    x="Sleep Difference",
    y="Sleep Efficiency"
  )+
  geom_smooth(method = "lm", se = FALSE, color="orange")+
  theme(plot.title = element_text(size=23, family="serif", face="bold"),
        axis.title = element_text(size=15, family ="serif"),
        axis.text = element_text(size = 10, family = "serif"))
## `geom_smooth()` using formula = 'y ~ x'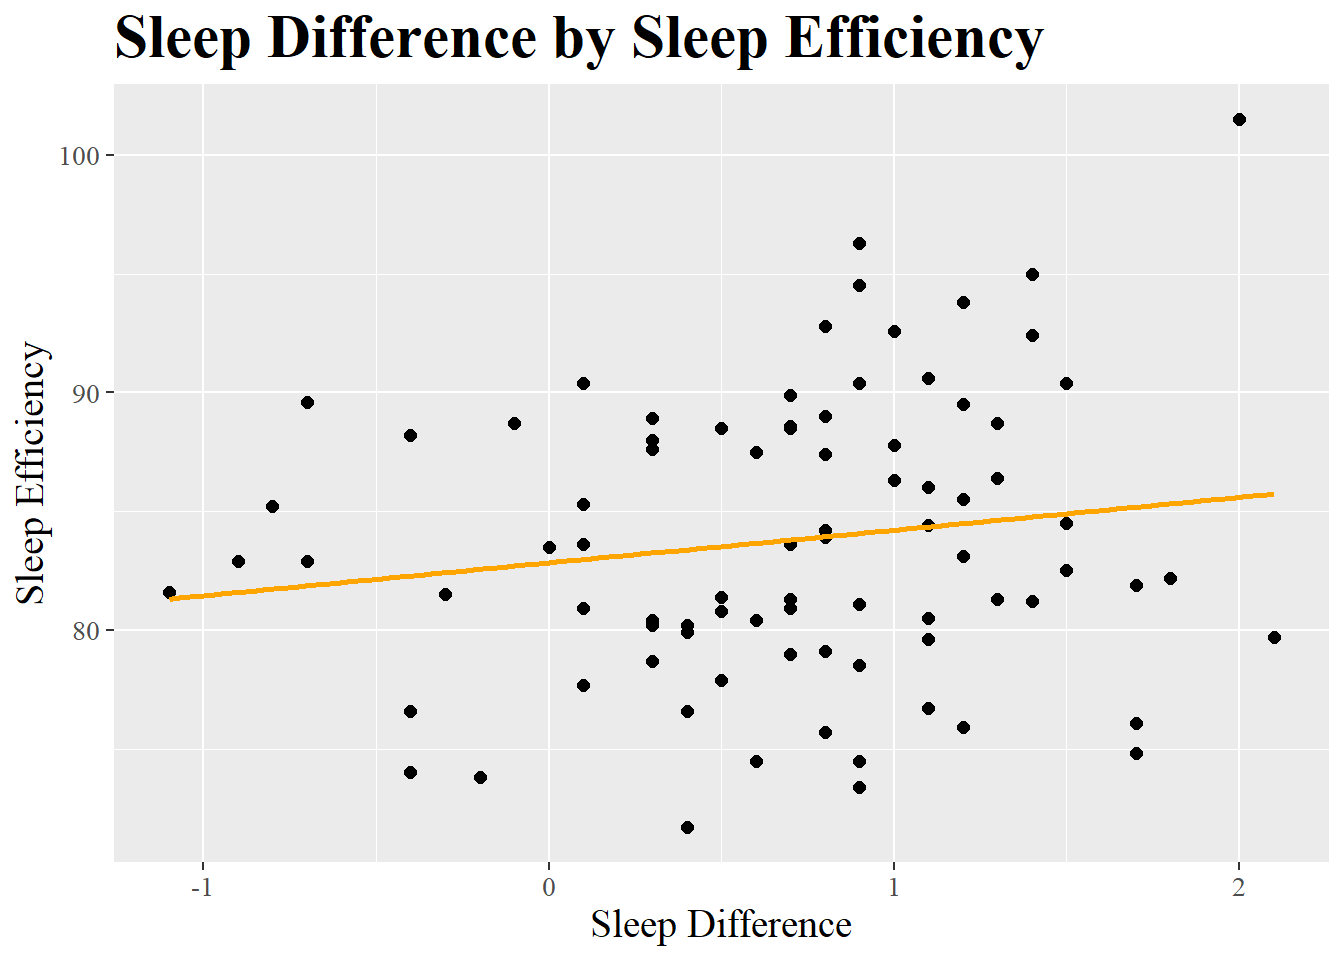
Figure 4.3: Graph with a trend line showing sleep difference by sleep efficiency in order to look at it visually
Above a graph was created with a trend line to look at sleep difference by sleep efficiency.
4.7 T-TEST’S
I went ahead and conducted two t-tests.
Below I conducted a two sample t-test for sleep difference by sex (male vs female).
##
##  Welch Two Sample t-test
##
## data:  Sleep_Difference by Sex
## t = 1.5801, df = 77.647, p-value = 0.1182
## alternative hypothesis: true difference in means between group Female and group Male is not equal to 0
## 95 percent confidence interval:
##  -0.05865017  0.50972574
## sample estimates:
## mean in group Female   mean in group Male
##            0.7795918            0.5540541
Mean in Female Group: 0.78
Mean in Male Group: 0.55
P value: 0.12
The difference between males and females in their sleep differences is not significant.
Below I conducted a two sample t-test for sleep difference by age group (young vs older adults).
SleepDiffbyAge_Ttest<-t.test(Sleep_Difference ~ AgeGroup2, data = Data_Midterm)
SleepDiffbyAge_Ttest
##
## Welch Two Sample t-test
##
## data: Sleep_Difference by AgeGroup2
## t = 0.79148, df = 83.467, p-value = 0.4309
## alternative hypothesis: true difference in means between group Older_Adult and group Younger_Adult is not equal to 0
## 95 percent confidence interval:
## -0.1712505 0.3976574
## sample estimates:
## mean in group Older_Adult mean in group Younger_Adult
## 0.7404762 0.6272727Mean in Older Adult Group: 0.74
Mean in Younger Adult Group: 0.63
P value: 0.43
The difference between younger adult and older adult participants in their sleep difference is not significant.
4.8 ANOVA’S
I went ahead and conducted two ANOVA’s along with posthoc comparisons if the ANOVA was significant.
Below I conducted an ANOVA for sleep difference by exercise group and posthoc comparisons.
SleepDiffbyExercise_ANOVA<-aov(Sleep_Difference ~ Exercise_Group, data = Data_Midterm)

summary(SleepDiffbyExercise_ANOVA)
## Df Sum Sq Mean Sq F value Pr(>F)
## Exercise_Group 3 13.56 4.520 15.72 3.67e-08 ***
## Residuals 82 23.58 0.288
## ---
## Signif. codes: 0 '***' 0.001 '**' 0.01 '*' 0.05 '.' 0.1 ' ' 1## Analysis of Variance Table (Type III SS)
## Model: Sleep_Difference ~ Exercise_Group
##
## SS df MS F PRE p
## ----- --------------- | ------ -- ----- ------ ----- -----
## Model (error reduced) | 13.560 3 4.520 15.717 .3651 .0000
## Error (from model) | 23.583 82 0.288
## ----- --------------- | ------ -- ----- ------ ----- -----
## Total (empty model) | 37.144 85 0.437Important Information for above:
F = 15.717
df = 85
p = .0000
PRE = .37
effect size = Small
##   Tukey multiple comparisons of means
##     95% family-wise confidence level
##
## Fit: aov(formula = Sleep_Difference ~ Exercise_Group, data = Data_Midterm)
##
## $Exercise_Group
##                              diff        lwr         upr     p adj
## Cardio+Weights-Cardio  -0.2772257 -0.7017134  0.14726203 0.3237562
## None-Cardio            -1.0904762 -1.5245041 -0.65644825 0.0000000
## Weights-Cardio         -0.4714286 -0.9054565 -0.03740063 0.0278779
## None-Cardio+Weights    -0.8132505 -1.2377382 -0.38876282 0.0000171
## Weights-Cardio+Weights -0.1942029 -0.6186906  0.23028480 0.6287294
## Weights-None            0.6190476  0.1850197  1.05307556 0.0018927
TukeyHSD for above code:
TukeyHSD:
No exercise is statistically different to Cardio (P=0.0000). Cardio has a greater mean difference of 1.09 than no exercise, meaning Cardio has a higher sleep difference.
Weights is statistically different to Cardio (P=0.03). Cardio has a greater mean difference of .47 than weights, meaning Cardio has a higher sleep difference.
No exercise is statistically different to Cardio + Weights (P= 0.00002). Cardio+weights has a greater mean difference of .81 than no exercise, meaning Cardio+weights has a higher sleep difference.
Weights is statistically different to no exercise (P=0.001). Weights has a greater mean difference of 0.62 than no exercise, meaning weights has a higher sleep difference.
Overall, Cardio has the best sleep difference due to having the largest mean difference (1.09) and smallest p value (p=0.000).
Below I conducted an ANOVA for sleep efficiency by exercise group and posthoc comparisons.
SleepEfficbyExercise_ANOVA<-aov(Sleep_Efficiency ~ Exercise_Group, data = Data_Midterm)

summary(SleepEfficbyExercise_ANOVA)
## Df Sum Sq Mean Sq F value Pr(>F)
## Exercise_Group 3 540.4 180.1 5.925 0.00104 **
## Residuals 82 2492.9 30.4
## ---
## Signif. codes: 0 '***' 0.001 '**' 0.01 '*' 0.05 '.' 0.1 ' ' 1## Analysis of Variance Table (Type III SS)
## Model: Sleep_Efficiency ~ Exercise_Group
##
## SS df MS F PRE p
## ----- --------------- | -------- -- ------- ----- ----- -----
## Model (error reduced) | 540.400 3 180.133 5.925 .1782 .0010
## Error (from model) | 2492.939 82 30.402
## ----- --------------- | -------- -- ------- ----- ----- -----
## Total (empty model) | 3033.339 85 35.686Important Information for above:
F = 5.93
df = 85
p = .001
PRE = .18
Effect size = Very Small
##   Tukey multiple comparisons of means
##     95% family-wise confidence level
##
## Fit: aov(formula = Sleep_Efficiency ~ Exercise_Group, data = Data_Midterm)
##
## $Exercise_Group
##                              diff        lwr         upr     p adj
## Cardio+Weights-Cardio   1.3871636  -2.977172  5.75149915 0.8383629
## None-Cardio            -4.3761905  -8.838613  0.08623232 0.0566544
## Weights-Cardio         -3.9904762  -8.452899  0.47194661 0.0962888
## None-Cardio+Weights    -5.7633540 -10.127690 -1.39901844 0.0046379
## Weights-Cardio+Weights -5.3776398  -9.741975 -1.01330416 0.0094267
## Weights-None            0.3857143  -4.076709  4.84813708 0.9958617
TukeyHSD for above code:
No exercise is not statistically different to Cardio but trending to significance (p= 0.057). Cardio has a greater mean difference of 4.38 than no exercise, meaning Cardio has a higher sleep efficiency.
No exercise is statistically significant to Cardio+Weights (p=0.005). Cardio+Weights has a greater mean difference of 5.76 than no exercise, meaning Cardio+Weights has a higher sleep efficiency.
Weights is statistically significant to Cardio+Weights (p=0.009). Cardio+Weights has a greater mean difference of 5.38 than weights, meaning Cardio+Weights has a higher sleep efficiency.
Overall Cardio+Weights has the best sleep efficiency due to having a greater mean (5.76 and 5.38) and smallest p value (0.005 and 0.009)
4.9 SYNTHESIS & RECOMMENDATION
If I had to pick one exercise regimen to recommend to improve overall sleep, I would recommend Weights+Cardio. Regardless of sex and age, Weights+Cardio was significant in improving sleep difference before and after exercise than no exercise (P= 0.00002) and improving sleep efficiency after this exercise rather than no exercise (p=0.005). Although Cardio had a smaller p value (P=0.0000) when compared to no exercise when it comes to sleep difference before and after exercise type, it was only trending to significance for sleep efficiency (p= 0.057). Cardio did improve sleep difference before and after more than Cardio+Weights, but did not significantly improve sleep efficiency. Visually, in graph 1 and 2, you can see that Cardio+Weights are close to each other, but Cardio+Weights exceeds Cardio in sleep efficiency. It is important to consider overall sleep, and therefore, I recommend Weights+Cardio.
4.10 REFLECTION
The most challenging part of this report was separating the column pre_sleep to have only the numbers for my analysis. I think I panicked, but after taking time to think and read over notes, I was able to figure it out and successfully run my code. I also felt that interpreting the pairwise comparisons was challenging as it has been a while doing posthoc, but I managed to finish! Overall, I felt confident in the rest of the task because I have been practicing my coding skills and always take my time when I do any assignment. It is like I relearn when I do assignments, which helps tremendously.